⧁
Getting Started
Predictors of Increased Poverty
The model will set default weights using the Random Forest Classifier
feature importance based on an increase of 2% or more for the selected indicator.
Random Forest Classifier
2016 predicting 2017 Poverty
For model training, a "y" column value of 1 indicated zip codes where poverty increased in 2017 after increasing or remaining steady from 2015 to 2016.
For model training, a "y" column value of 1 indicated zip codes where poverty increased in 2017 after increasing or remaining steady from 2015 to 2016.
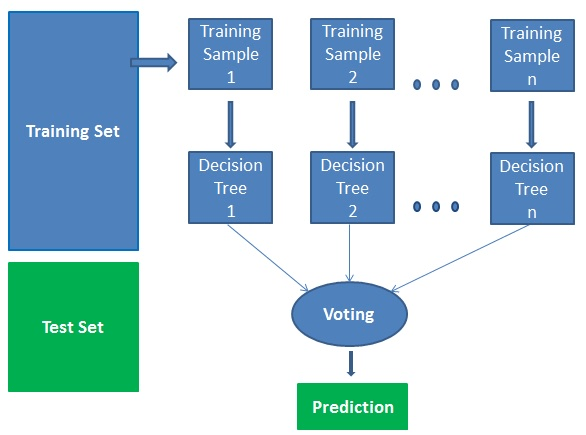
Best Params:
max depth: 8;
n-estimators: 100
Accuracy before tuning: 69%. Accuracy after tuning: 71%.
Accuracy before tuning: 69%. Accuracy after tuning: 71%.
ⓧ
1
Choose Area of Focus
We'll generate a map with clusters corresponding to your theme.
Where would you like
Where would you like
to focus your efforts?
Education Needs
Work Experience Needs
Youth Below Poverty Level
Adults Below Poverty Level
Seniors Below Poverty Level
Work Experience Needs
Youth Below Poverty Level
Adults Below Poverty Level
Seniors Below Poverty Level